|
Settings
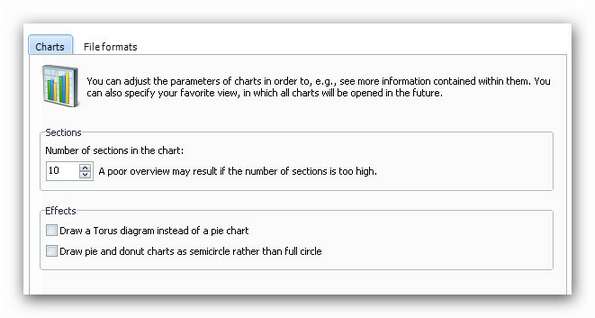
Diagrams You can choose and change the visual output by changing the chart options. Here you can also define the number of sectors (colored parts) in the diagrams. Furthermore, instead of the pie chart, a Torus diagram (often called donut chart) can be displayed or you can have these diagrams displayed as a semicircle instead of a full circle.
File formats Select which file formats are to be considered in the report. File formats must be separated by semicolons (e.g. video file formats: AVI ; MPG ; MPEG ; RW ; WMV ; MOV ; VOB etc.).
|

